Map Making 

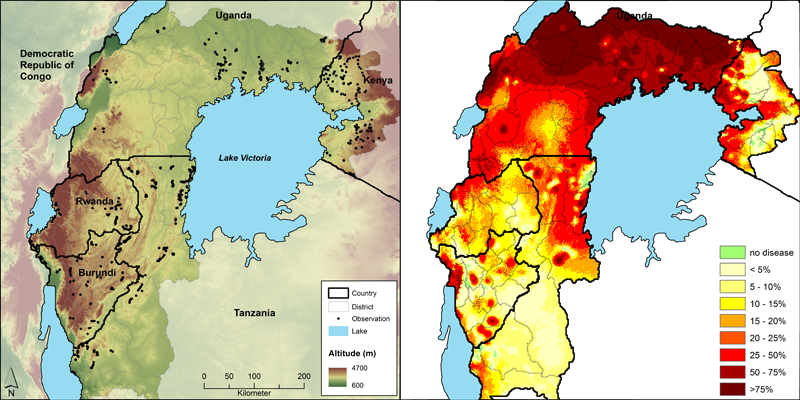
GeoSpace makes maps of research outcomes of various topics and themes. Until now, GeoSpace mainly mapped agricultural production across East Africa. The maps were used in reports and in peer-reviewed articles that looked at crop distribution and at the spread of pests and diseases. In many cases, authors do not have the expertise that is necessary to make figures and maps of the data they collect. GeoSpace has the capability to quickly understand the datasets and to convert the data into maps. GeoSpace also has the expertise to find background environmental and topological geo-information.

Observation locations of BXW disease incidence as black dots and altitude as background (left map) and percentage land that is infected by the disease (right map).

Map of banana bunchy top disease distribution in DR Congo
Banana disease (BXW) incidence (A), banana consumption as % of caloric intake (B) and food insecurity (C) define the prioritization areas (D) in targeting BXW.
Map of banana and disease distribution in Ethiopia