2011 | Geostatistical Spatial Pattern analysis
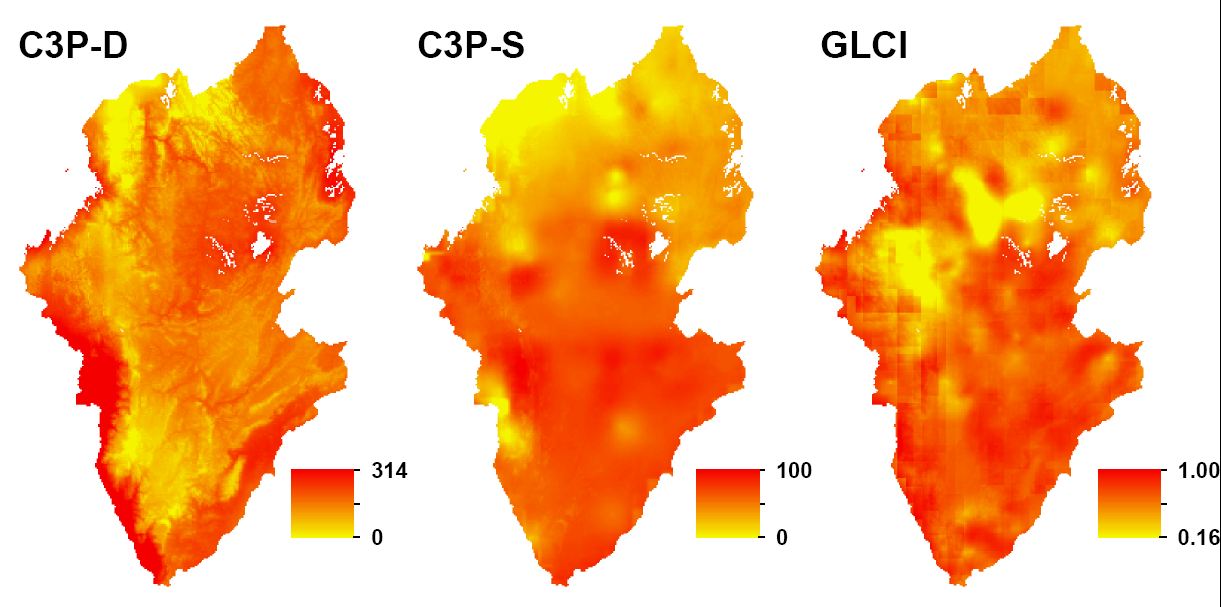
This project compared the spatial distribution of the cassava virus CMD assessed by three independent surveys in Rwanda and Burundi. Geostatistical techniques were used to interpolate the point-based surveys and predict the spatial distributions of different measures of the disease. Correlative relationships were examined for 35 environmental and socio-economic spatial variables with highest correlation coefficients for latitude (-0.47), altitude (-0.36) and temperature (+0.36). Linear regression models explained up to 54% of the variation in CMD. The residuals of the regression models were interpolated using kriging and added to the regression models to map CMD across both countries. Significant differences were calculated in some areas after correcting for interpolation error. An important explanation of the differences is interaction between the CMD pandemic and the dates of the three surveys. Large relative prediction errors obtained in the regression kriging procedure show the need to improve the survey design and decrease measurement error. Improved maps of crop diseases such as CMD could aid targeting of control interventions and thereby contribute to increasing crop yields. The project emphasized the need for optimization of sampling designs and survey protocols to maximize the potential of regression kriging. Read entire publication
